25.06.2020: Updated the circuit diagrams.
So far I have kept to the plan.
1. Test the sensors with a basic sketch
2. Create a basic website using websockets to show the sensor data.
3. Enhance the website, add dials and a graph.
4. Add a LCD
5. Add Wifi Manager.
6. Maybe add time to the LCD version using a NTP server.
7. Put the project in to a stand
Sections 1 to 3 are complete and in this part I want to add a LCD.
Add a LCD
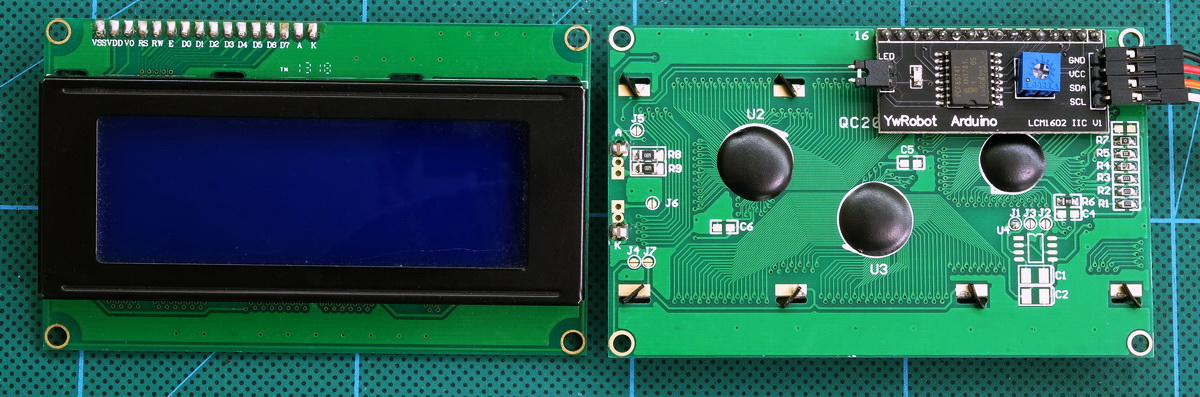
I am using a 4×20 LED with a I2C daughter board/serial to parallel converter. The I2C adapter means we only need 4 connections; 2 for power and 2 for data. For more information on this kind of LCD see Arduino with HD44780 based Character LCDs.
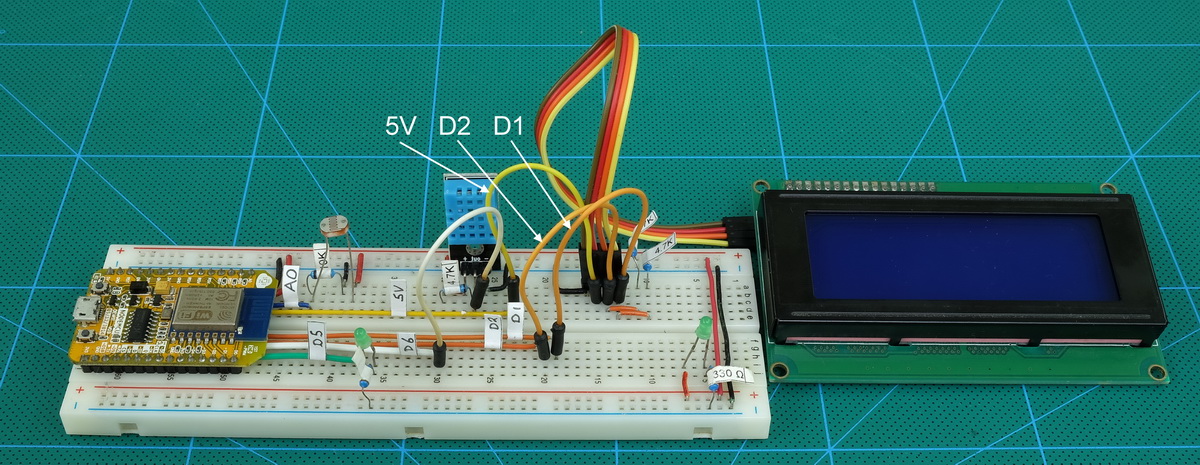
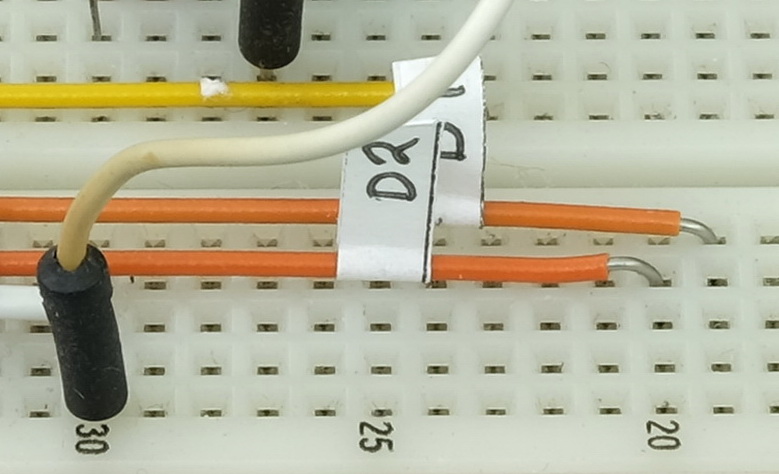 In preparation of adding the LCD I already have connections to pin D1 and D2.
On the ESP8266 NodeMCU D1 is SDA and D2 SCL. SDA and SCL are connections used by I2C. I2C is a serial protocol similar to serial UART but with some advanced features. I2C is used by many sensors and modules including many LCDs and small displays.
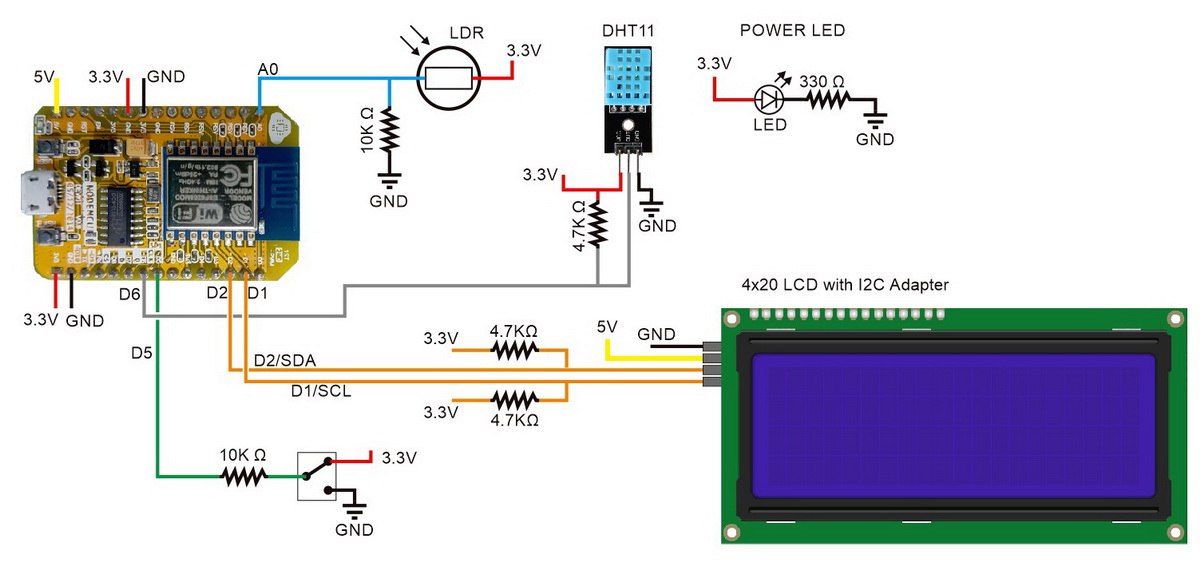
Circuit
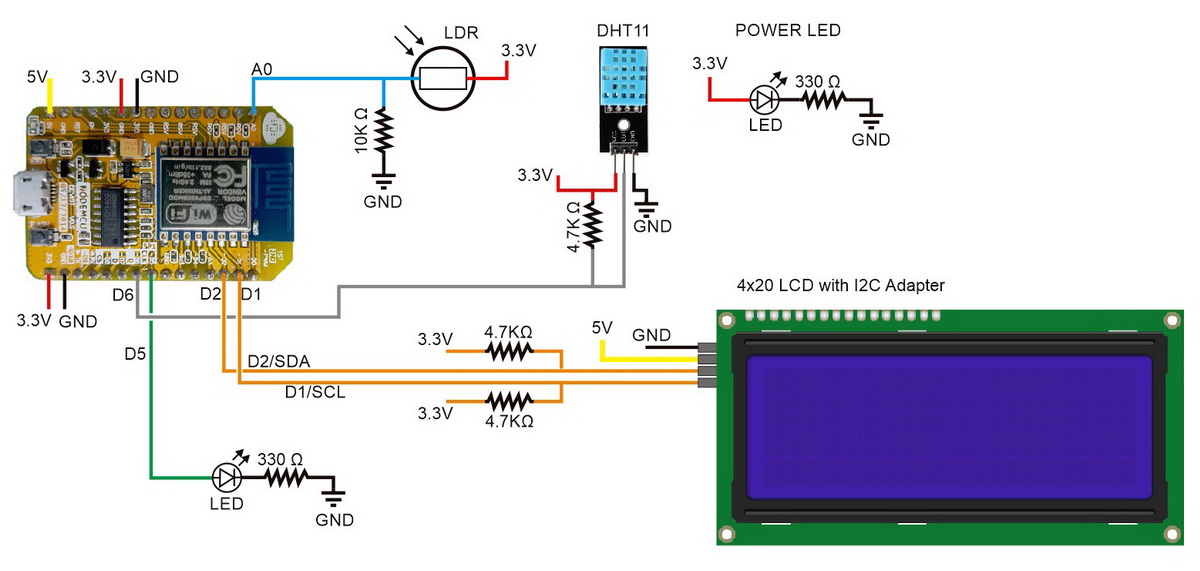
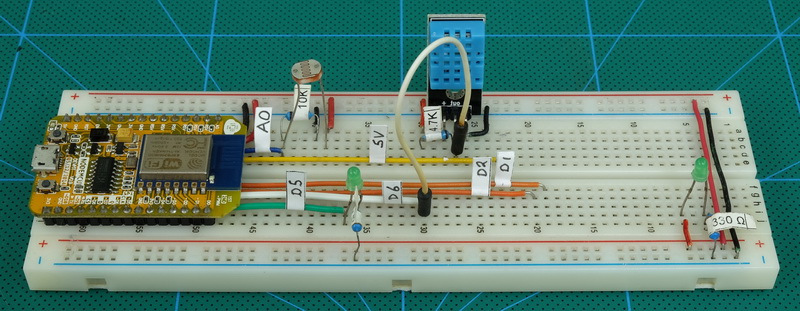
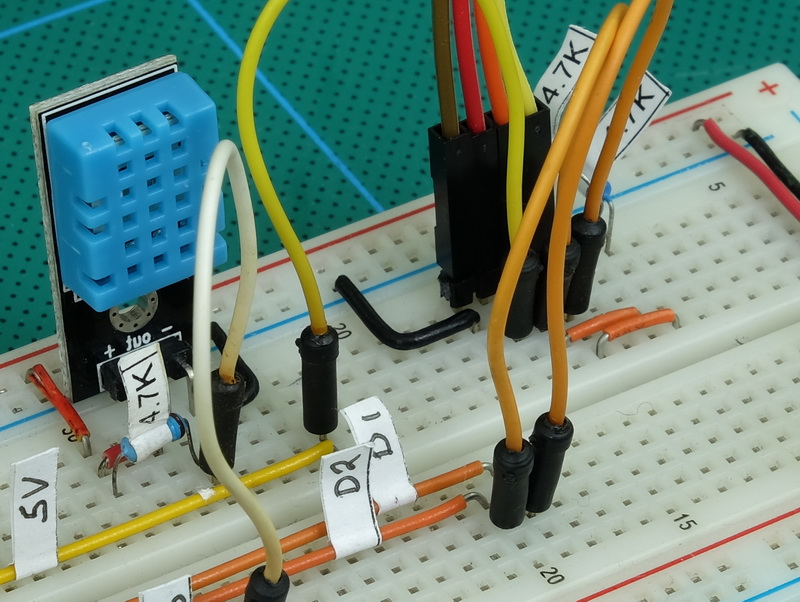
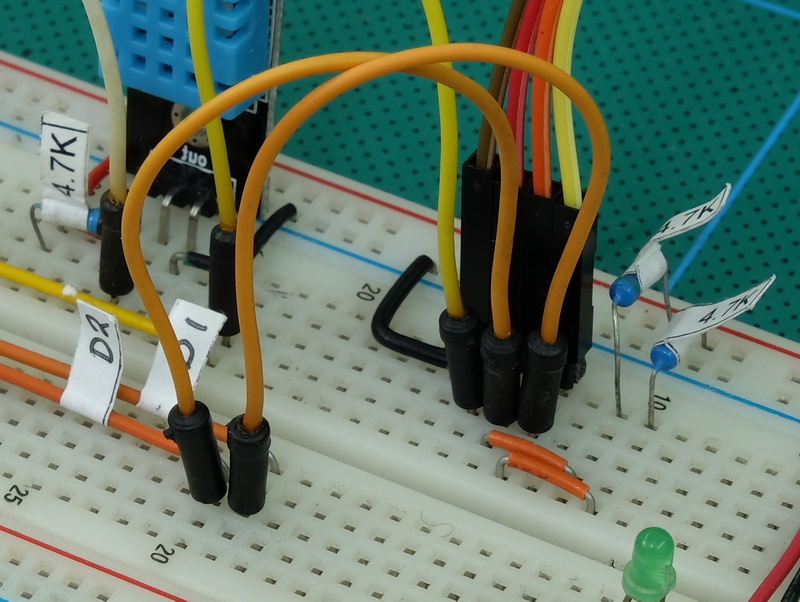
I already had the connections for D1 and D2 broken out. All I need do is connect them to the LCD and add the pullup resistors. One thing to take care with. The LCD is 5V so the LCD vcc is connected to the 5V out on the NodeMCU module. Take care not to short/connect this to other pins on the board.
– LCD SCL to pin D1 with a 4.7K ohm pullup resistor
– LCD SDA to pin D2 with a 4.7K ohm pullup resistor
– LCD VCC to 5V
– LCD GND to GND
LCD Test
A quick test to make sure the LCD is working. Since I am using a I2C adapter on the LCD I need a suitable library (the LCD library that comes with the IDE does not support I2C). There are a few different ones and the one I am using is LiquidCrystal_I2C by Marco Schwartz (the Github repository is under John Rickman).
This library is not available in the IDE Library Manager so you will need to go old skool and manually download it and copy it to the libraries folder found in the Arduino installation folder. I use portable versions of the IDE so, for me, finding the folder is fairly easy.
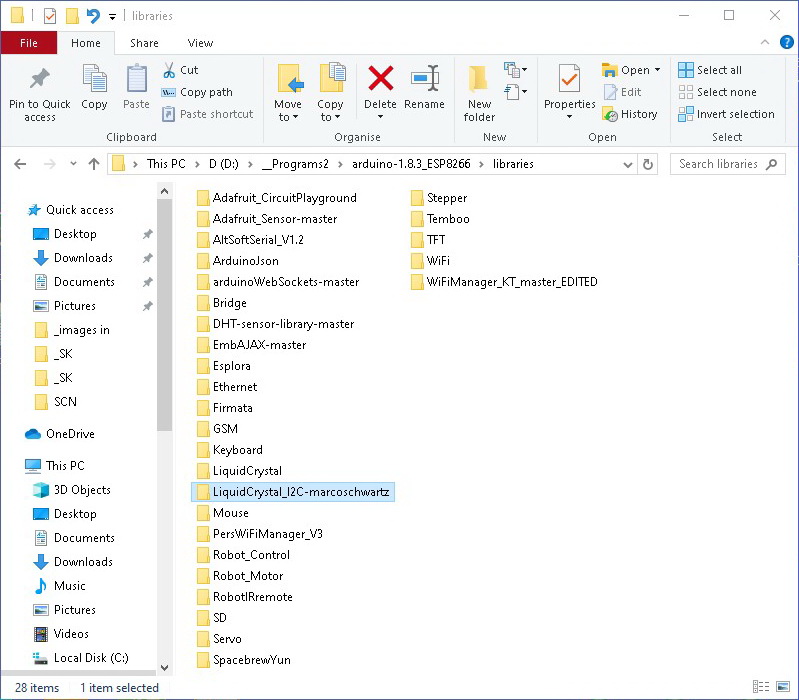 I’ve renamed the folder to include Marco’s name. You don’t need to do this but there are many similar libraries with similar folder names renaming like this lets me track which one I am using.
After copying the library you need to restart the IDE.
LCD Test Sketch
// // ESP8266 and the Arduino IDE Part 10C: Add LCD // ESP8266-10C_sketch01_LCD-TEST #include <LiquidCrystal_I2C.h> LiquidCrystal_I2C lcd(0x27, 20, 4); void setup() { lcd.begin(20,4); lcd.init(); lcd.backlight(); lcd.setCursor(0, 0); lcd.print("ESP8266 Part 10C"); lcd.setCursor(0, 1); lcd.print("LCD TEST"); } void loop() { } |
The LCD I am using has a I2C address of HEX 0x27. This is very common but not all LCDs use the same address
LiquidCrystal_I2C lcd(0x27, 20, 4); |
Upload and run the sketch and if everything is connected correctly to will see the ESP866 message.
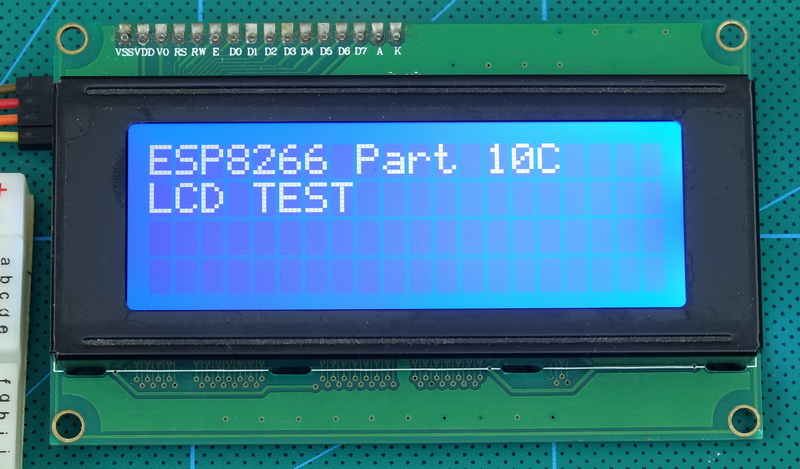
If you don’t see the message check the connections, the I2C address, and the LCD contrast setting.
– 2 rows of blocks normally means the LCD is powered bu has not received any commands.
– 4 rows of blocks (sometimes low contract) normally means the wrong address.
Adding the LCD to the IOT Sketch
We have the LCD working so let’s add it to the main project. If you look at the test sketch you can see what is required to get the LCD working:
Include the library and create a LCD object (address 0x27, screen size 20×4).
#include <LiquidCrystal_I2C.h> LiquidCrystal_I2C lcd(0x27, 20, 4); |
Start the LCD.
lcd.begin(20,4); lcd.init(); |
then to display something we need to print.
lcd.setCursor(0, 0); lcd.print("ESP8266 Part 10C"); lcd.setCursor(0, 1); lcd.print("LCD TEST"); |
Screen Layout
Before we print the sensor data we need to decide the layout. The screen I am using I has 4 rows of 20 characters. This is more than enough space to show all the values.
Here is the initial layout. dots are spaces. From this I can workout(count the character places) where the sensors values will go. The LCD uses x/y coordinates starting at the top left (0,0) down to the bottom right (19,3).
20 x 4
....................    ESP8266:.IOT.Monitor
....................    Temperature:.xxxxx°C
....................    Humidity:....xxxxx%.
....................    Brightness:..xx.....
Updating the Sketch
I am starting with the sketch ESP8266-10_sketch04_IOT_Website_02. This is updated and saved as ESP8266-10C_sketch02_IOT_WebsiteWithLCD. The HTML is not changing so I am only showing the main tab. Just remember you need both files for the sketch to compile.
At the top of the sketch add the include and LCD library initialization statements.
// // ESP8266 and the Arduino IDE Part 10: Environment monitor station // ESP8266-10C_sketch02_IOT_WebsiteWithLCD // #include "webpage.h" #include <LiquidCrystal_I2C.h> LiquidCrystal_I2C lcd(0x27, 20, 4); |
and in setup() add the begin and init statements
void setup() { lcd.begin(20,4); lcd.init(); lcd.backlight(); |
now we need to add the print statements. These can be added to the updateSensors() function. I inserted the extra code just after the websocket statement.
webSocket.broadcastTXT(data); // send the data Serial.println(data); // display the data in the serial monitor lcd.setCursor(0, 0); lcd.print("ESP8266: IOT Monitor"); lcd.setCursor(0, 1); lcd.print("Temperature: "); lcd.setCursor(0, 2); lcd.print("Humidity: "); lcd.setCursor(0, 3); lcd.print("Brightness: "); lcd.setCursor(13, 1); lcd.print(tempC); lcd.write(223); lcd.print("C"); lcd.setCursor(13, 2); lcd.print(humidity); lcd.print("%"); lcd.setCursor(13, 3); lcd.print(brightness); |
lcd.write(223) is the code for the degree symbol. The code can be different on some LCDs.
lcd.setCursor(13, 1); lcd.print(tempC); lcd.write(223); lcd.print("C"); |
Printing all characters every time the screen is updated is a little wasteful and slow, however, for this example, the screen update speed is not a concern and printing the whole screen means it is easy to see what the result should be. Note the spaces. These clear the old sensor values.
ESP8266-10C_sketch02_IOT_WebsiteWithLCD
// // ESP8266 and the Arduino IDE Part 10: Environment monitor station // ESP8266-10C_sketch02_IOT_WebsiteWithLCD // #include "webpage.h" #include <LiquidCrystal_I2C.h> LiquidCrystal_I2C lcd(0x27, 20, 4); #include <ESP8266WiFi.h> #include <WebSocketsServer.h> WiFiServer server(80); WebSocketsServer webSocket = WebSocketsServer(81); char ssid[] = "mySSID"; char pass[]= "myPassword"; #include "DHT.h" #define DHTPIN D6 #define DHTTYPE DHT11 DHT dht(DHTPIN, DHTTYPE); byte const pinLED = D5; byte const pinLDR = A0; int brightness = 0; float humidity = 0; float tempC = 0; float tempF = 0; boolean DHTreadingsOK = false; boolean updateWebpage = false; long sensorUpdateFrequency = 5000; long timeNow = 0; long timePrev = 0; void setup() { lcd.begin(20,4); lcd.init(); lcd.backlight(); pinMode(pinLED, OUTPUT); digitalWrite(pinLED, LOW); dht.begin(); Serial.begin(9600); while (!Serial) {;} Serial.println(); Serial.println("Serial started at 9600"); Serial.println(); // Connect to a WiFi network Serial.print("Connecting to "); Serial.println(ssid); // try to connect to the network WiFi.begin(ssid,pass); // connection with timeout int count = 0; digitalWrite(pinLED, HIGH); while ( (WiFi.status() != WL_CONNECTED) && count < 17) { Serial.print("."); count++; delay(500); } digitalWrite(pinLED, LOW); if (WiFi.status() != WL_CONNECTED) { Serial.println(""); Serial.print("Failed to connect to "); Serial.println(ssid); while(1); } Serial.println(""); Serial.print("Connected. IP address = "); Serial.println(WiFi.localIP()); // start a server server.begin(); Serial.println("Server started"); // start the websocket webSocket.begin(); Serial.println("websocket started"); Serial.println(""); Serial.println(""); // webSocketEvent is the function to call when there is a websocket event webSocket.onEvent(webSocketEvent); } void loop() { // check the websocket status. webSocket.loop(); // Check if a client has connected WiFiClient client = server.available(); // if a client has connected send the webpage if (client) { client.flush(); client.print( header ); client.print( html_1 ); Serial.println("New page served"); Serial.println(""); updateSensors(); } // see if it is time to update the sensor values on the website timeNow = millis(); if (timeNow - timePrev >= sensorUpdateFrequency) { timePrev = timeNow; // if it is time, call the updateSensors() function updateSensors(); } } // void loop() void updateSensors() { brightness = map(analogRead(pinLDR), 0, 1023, 0, 12); //brightness = analogRead(pinLDR); humidity = dht.readHumidity(); tempC = dht.readTemperature(); // Read temperature as Celsius tempF = dht.readTemperature(true); // Read temperature as Fahrenheit (isFahrenheit = true) //if any value is isnan (not a number) then there is an error if (isnan(humidity) || isnan(tempC) || isnan(tempF)) { Serial.println("Error reading from the DHT11."); } else { String data = ""; data = String(data + byte(humidity) ); data = String(data + "|"); data = String(data + tempC); data = String(data + "|"); data = String(data + tempF); data = String(data + "|"); data = String(data + brightness); webSocket.broadcastTXT(data); // send the data Serial.println(data); // display the data in the serial monitor lcd.setCursor(0, 0); lcd.print("ESP8266: IOT Monitor"); lcd.setCursor(0, 1); lcd.print("Temperature: "); lcd.setCursor(0, 2); lcd.print("Humidity: "); lcd.setCursor(0, 3); lcd.print("Brightness: "); lcd.setCursor(13, 1); lcd.print(tempC); lcd.write(223); lcd.print("C"); lcd.setCursor(13, 2); lcd.print(humidity); lcd.print("%"); lcd.setCursor(13, 3); lcd.print(brightness); // blink the status LED to show data has been sent digitalWrite(pinLED, HIGH); delay(50); digitalWrite(pinLED, LOW); } } // void updateSensors() // webSocketEvent is called when there is a websocket event void webSocketEvent(byte num, WStype_t type, uint8_t * payload, size_t length) { Serial.println(""); Serial.print("WStype = "); Serial.println(type); Serial.print("WS payload = "); for(int i = 0; i < length; i++) { Serial.print((char) payload[i]); } Serial.println(); } |
Download ESP8266-10C_sketch02_IOT_WebsiteWithLCD
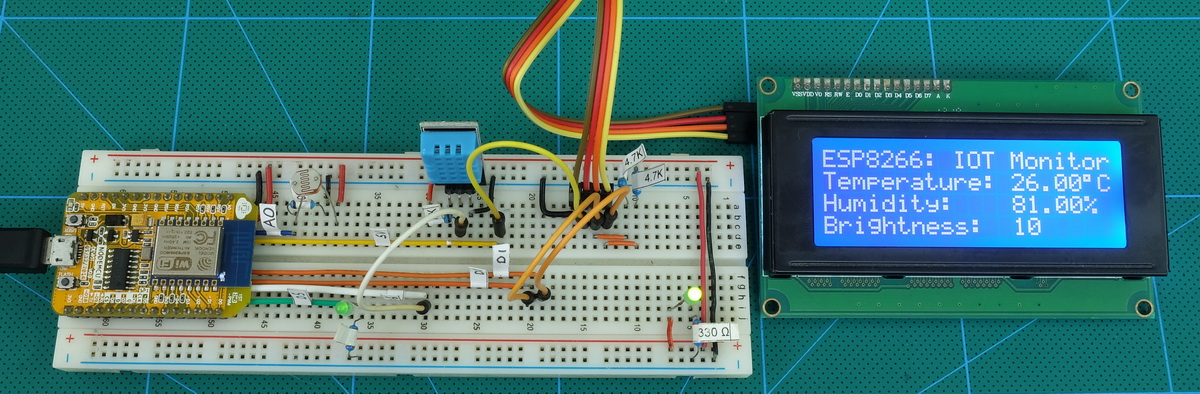
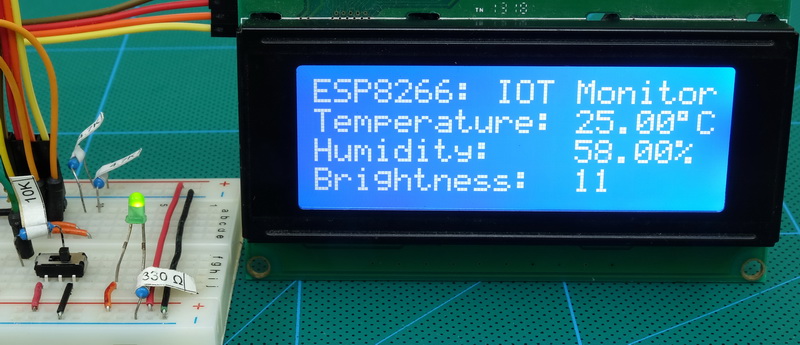
If you have everything connected correctly you now have a stand alone temperature, humidity, and brightness monitor station.
Changing the Temperature Unit
The eagle eyed will have noticed that the sketch reads the temperature in Celsius and Fahrenheit but only Celsius is displayed. Let’s add the facility to switch between the two by changing the LED on pin D4 to a switch. We can then use the switch position to determine which temperature unit to display.
Circuit
The LED on pin D5 has been swapped to a two position switch. One side connected to 3.3V and the other side connected to ground.
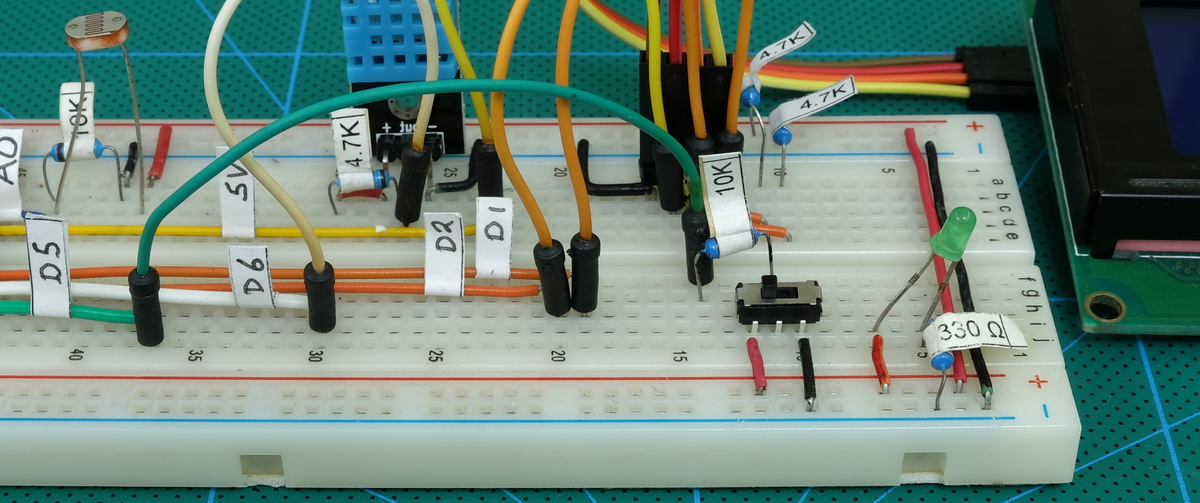
To determine which until to use we will read D5; if it is LOW use Celsius and if it is HIGH use Fahrenheit.
Switch Test Sketch
Let’s start with testing the switch to make sure it works as expected.
// // ESP8266 and the Arduino IDE Part 10: Environment monitor station // ESP8266-10C_sketch03_SwitchTest // int switch_PIN = D5; void setup() { pinMode(switch_PIN, INPUT); Serial.begin(9600); while (!Serial) {;} } void loop() { if (digitalRead (switch_PIN) == LOW ) { Serial.println( "LOW" ); } else { Serial.println( "HIGH" ); } delay(500); } |
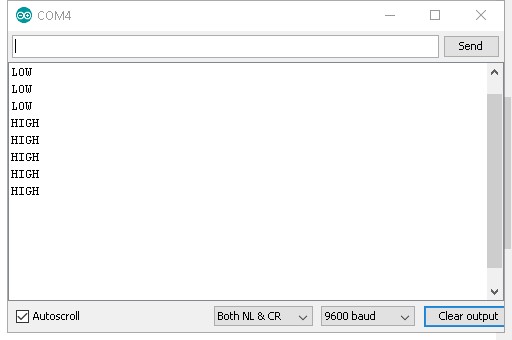
Move the switch the the signal goes from LOW to HIGH.
The switch is working so it’s time to add it to the main sketch. At the moment pin D5 is used for a LED so we need to change the pin function from OUTPUT to INPUT and then, at some point, read the pin.
At the top of the sketch I’ve renamed the pin to show it is now connected to a switch and also introduced a new variable to hold the switch state. The new variable is not really required but makes the code easier to read.
byte const pinSWITCH = D5; boolean switchPinState = LOW; |
In setup() the pin is set to INPUT
pinMode(pinSWITCH, INPUT); |
and in updateSensors() the pin state is read; if the pin is LOW Celsius is displayed and if the pin is HIGH Faranheit is displayed. If the Fahrenheit value is above 100 the cursor position is moved to the left one place.
switchPinState = digitalRead(pinSWITCH); if (switchPinState == LOW ) { lcd.setCursor(13, 1); lcd.print(tempC); lcd.write(223); lcd.print("C"); } else { if ( tempF < 100 ) { lcd.setCursor(13, 1); } else { lcd.setCursor(12, 1); } lcd.print(tempF); lcd.write(223); lcd.print("F"); } |
Download ESP8266-10C_sketch04_TemperatureSwitch
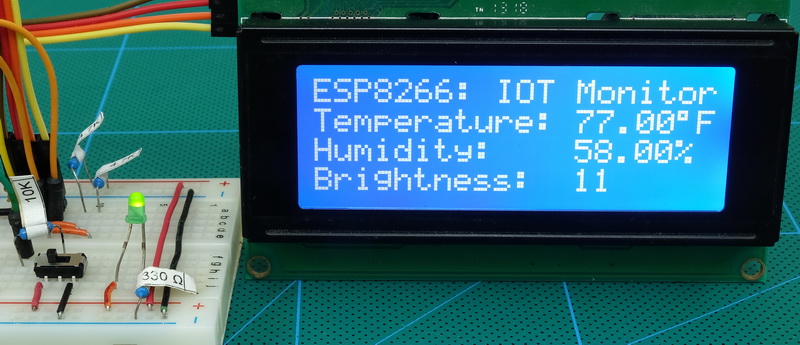
Move the switch to the right to select Celsius and move it to the left for Fahrenheit.
Updating the Webpage
The LCD updates, what about the webpage. Let’s do that now. I actually forgot to do this and had to come back and add it.
Both temperatures are already sent to the webpage so all we need is to determine which one to show and then show it. Had I planned for this life would have been a little easier. Shame I didn’t.
Arduino code
To show which scale to use I am adding an extra field to the end of the data; C for Celsius and F for Fahrenheit. I am using a new variable called whichTemp to hold the new value. This is not really required but helps make the code easier to read. This is the only change to the main sketch. All the other changes are within the javascript.
switchPinState = digitalRead(pinSWITCH); String whichTemp = ""; if (switchPinState==true) {whichTemp = "F";} else {whichTemp = "C";} String data = ""; data = String(data + byte(humidity) ); data = String(data + "|"); data = String(data + tempC); data = String(data + "|"); data = String(data + tempF); data = String(data + "|"); data = String(data + brightness); data = String(data + "|"); data = String(data + whichTemp); |
Javascript
Most of the updates are in the javascript used to update the webpage.
Dial and graph initialization
The dial and graph initialization depended on knowing the scale to use. The default was Celsius but this no longer the case. If the user has selected Celsius before starting then all is good but if Fahrenheit is selected the dial and graph are first drawn with the wrong scale and then they jump when the first values are received. To address this I have simply removed the initialization functions. This means the dials and graph are not drawn until values are received.
Others things to consider
What happens to the graph when the temperature changes scale; C to F or F to C? The 2 use different ranges. I feel it best to restart the graph so there are no weird values mid-way.
How to track when the temperature scale changes so that the graph is restarted at the correct time.
Both C and F are now displayed so we need a way of changing them when the scale changes.
Minor change to the HTML
Rather than messing around with another span and more code to change the temperature label (C and F) label I felt it easier to simply add the degree label to the temperature value and remove it from the HTML.
<div id='dial_1'> <h3>Temperature</h3> <canvas id='canvasTemp' width='200' height='150' style='border:1px solid #000000;' > </canvas> <p class='noMargin bigText'><span id='temp'>00</span></p> </div> <div id='dial_2'> <h3>Humidity</h3> <canvas id='canvasHumid' width='200' height='150' style='border:1px solid #000000;' > </canvas> <p class='noMargin bigText'><span id='humd'>00</span></p> </div> |
and in the javascript the temperature label is added to the temperature value when the inner HTML is replaced.
. . // if using Celsius tempSymbol = '°C'; . . // if using Fahrenheit tempSymbol = '°F'; . . document.getElementById('temp').innerHTML = temperature + tempSymbol; |
Only relevant code shown.
Changes to the javascript
The dial and graph initialization has been remove from the init() function.
function init() { Socket = new WebSocket('ws://' + window.location.hostname + ':81/'); Socket.onmessage = function(event) { processReceivedData(event); }; // myVarTime is a timer used to update the time displayed in the page. // when the timer fires is calls the function updateTime() var myVarTime = setInterval(updateTime, 1000); console.log('started'); } |
The updateValues() function is no longer used and the code has been moved to the processReceivedData() function. This makes the code flow simpler. The new processReceivedData() function is considerable larger though. The drawDial() and drawGraph() functions have not changed.
function processReceivedData(evt) { // new data has been received via the websocket var data = evt.data; console.log(data); // the data is a single string. Data is | separated so use the bar character to split the data in to array elements. var tmp = data.split('|'); // convert the received values in to numbers var h = parseInt(tmp[0]); var tc = parseInt(tmp[1]); var tf = parseInt(tmp[2]); var b = parseInt(tmp[3]); var whichTemp = (tmp[4]); // (C or F) // if the temperature scale has changed reset all the values used for the graph. // I am reseting humidity as well as temperature. if ( oldTemp != whichTemp ) { tempArray = [ -9999,-9999,-9999,-9999,-9999,-9999,-9999,-9999,-9999,-9999,-9999,-9999,-9999,-9999,-9999,-9999,-9999,-9999,-9999,-9999 ]; humdArray = [ -9999,-9999,-9999,-9999,-9999,-9999,-9999,-9999,-9999,-9999,-9999,-9999,-9999,-9999,-9999,-9999,-9999,-9999,-9999,-9999 ]; oldTemp = whichTemp; } // the brightness value uses the same range every time so we can draw the sun logo drawSVG(b); // the humidity value use the same range every time so we can draw the humidity dial var arcStartDegree = 160; var arcStopDegree = 20; var dialMinVal = 0; var dialMaxVal = 100; // humidity dial drawDial('canvasHumid', '#aaaaff', arcStartDegree, arcStopDegree, dialMinVal, dialMaxVal, h); document.getElementById('humd').innerHTML = h + '%'; // temperature. If using Celsius the range is -30 to 50. If using Fahrenheit the range is 20 to 120. // temperature dial var tempSymbol = ''; var temperature = 0; if (whichTemp=="C") { dialMinVal = -30; dialMaxVal = 50; temperature = tc; tempSymbol = '°C'; } else { dialMinVal = 20; dialMaxVal = 120; temperature = tf; tempSymbol = '°F'; } drawDial('canvasTemp', '#ffaaaa', arcStartDegree, arcStopDegree, dialMinVal, dialMaxVal, temperature); document.getElementById('temp').innerHTML = temperature + tempSymbol; // graph // remember to take in to account the humidity range 0 -100 and the range is used for the temperature should cover humidity. var graphCanvas = 'graph'; var drawDataPoints = true; var graphMin = 0; var graphMax = 0; if (whichTemp=="C") { graphMin = -30; graphMax = 100; temperature = tc; } else // temperature is in F { graphMin = 0; graphMax = 120; temperature = tf; } drawGraph(graphCanvas, graphMin, graphMax, drawDataPoints, temperature, h); } |
The data is received the same as before, this time though there is an extra field used to show what temperature to use (C or F).
var tmp = data.split('|'); // convert the received values in to numbers var h = parseInt(tmp[0]); var tc = parseInt(tmp[1]); var tf = parseInt(tmp[2]); var b = parseInt(tmp[3]); var whichTemp = (tmp[4]); // (C or F) |
The value is copied to whichTemp and then whichTemp is later used to determine the values to use for the temperature dial and temperature in the graph (Celsius or Fahrenheit).
The new variable oldTemp is used to track the previous temperature scale and if it is not the same as the new whichTemp then we know the scale to use has changed; either from C to F or from F to C.
If the scale has changed then the temperature and humidity values are reset. This in turn resets the graph.
if ( oldTemp != whichTemp ) { tempArray = [ -9999,-9999,-9999,-9999,-9999,-9999,-9999,-9999,-9999,-9999,-9999,-9999,-9999,-9999,-9999,-9999,-9999,-9999,-9999,-9999 ]; humdArray = [ -9999,-9999,-9999,-9999,-9999,-9999,-9999,-9999,-9999,-9999,-9999,-9999,-9999,-9999,-9999,-9999,-9999,-9999,-9999,-9999 ]; oldTemp = whichTemp; } |
I have kept the code for the dials and the code for the graph separate. This is not the most efficient method and means slightly more code but makes the code easier to understand.
If the temperature is in Celsius the range used is -30 to 50 and if Fahrenheit the range is 20 to 120. These can be changed to suit your own preferences. Just edit the the values in the code.
// temperature dial var tempSymbol = ''; var temperature = 0; if (whichTemp=="C") { dialMinVal = -30; dialMaxVal = 50; temperature = tc; tempSymbol = '°C'; } else { dialMinVal = 20; dialMaxVal = 120; temperature = tf; tempSymbol = '°F'; } drawDial('canvasTemp', '#ffaaaa', arcStartDegree, arcStopDegree, dialMinVal, dialMaxVal, temperature); document.getElementById('temp').innerHTML = temperature + tempSymbol; |
The graph also has a different scale depending on which temperature is being displayed. However, the graph also shows the humidity so the range must at least be 0 – 100.
// graph // remember to take in to account the humidity range 0 -100 and the range is used for the temperature should cover humidity. var graphCanvas = 'graph'; var drawDataPoints = true; var graphMin = 0; var graphMax = 0; if (whichTemp=="C") { graphMin = -30; graphMax = 100; temperature = tc; } else // temperature is in F { graphMin = 0; graphMax = 120; temperature = tf; } drawGraph(graphCanvas, graphMin, graphMax, drawDataPoints, temperature, h); } |
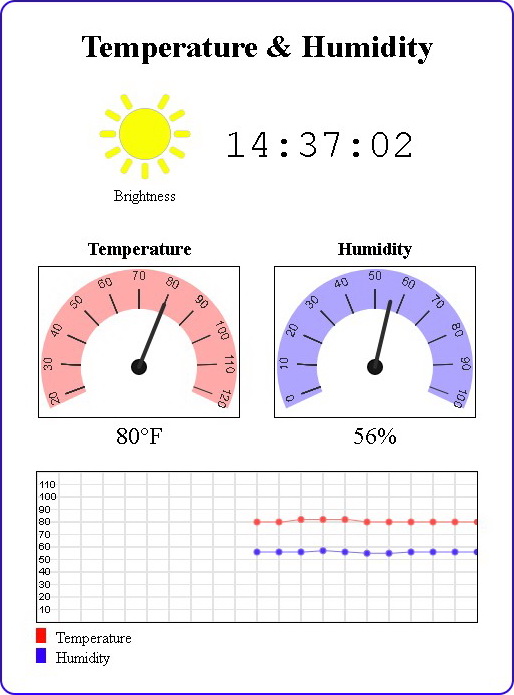

And now we have a webpage that updates as well as the LCD.
Downloads
Download ESP8266-10C_sketch02_IOT_WebsiteWithLCD
Download ESP8266-10C_sketch04_TemperatureSwitch
Download ESP8266-10C_sketch05_TemperatureSwitch2
That be it for this section. We have a temperature, humidity, and brightness monitor that can be used with a web app or as a standalone station. To use the web app we still need to connect to a computer and use the serial monitor to get the ip address though. In the next part we add Wifi Manager to address this.