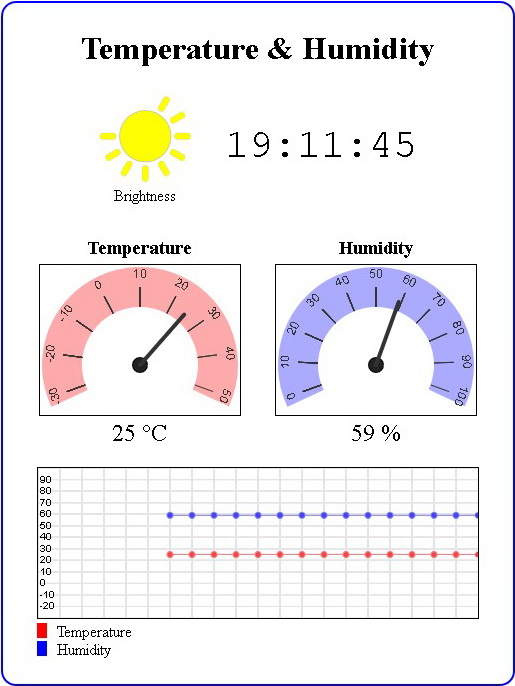
Enhancing the Website
We are now ready to implement the final webpage.
 The hard part is the html and javascript for the widgets. The code for the sketch is pretty much the same as in the previous example.
 In the last post we ended with a working but very basic website. Now it’s time to make the webpage look nicer. Be aware that I am not a graphic artist and use the word nicer very loosely.
When I started to think about a part 10 for the ESP8266 guide I also became interested in webpage widgets and thought it might be a good idea to combine the two.
I starting by searching on line for existing widgets and there are many. Almost all are very heavy (large code) and too complex for what I wanted though. I wanted something simple and lightweight so I developed my own. This took longer than expected, I had to relearn basic math (especially degrees and radians) and had limited free time to do it. The graphics are basic but I feel widgets work quite well. They certainly do what I wanted.
As with the basic website, I developed the new page as a separate project using dummy data for the sensor values. Once I had the page working I copied to the ESP8266 sketch. I won’t post the file here and if you are interested you can download it.
I did think about putting the dial and the graph in to javascript libraries but ultimately decided against it. I wanted to keep the code as simply as possible so it would be easier to understand.
Time
The time displayed on the website is taken from the system used to display the webpage. This could be a computer or a mobile device.
  function updateTime()
  {
     var d = new Date();
     var t = d.toLocaleTimeString();
     document.getElementById('time').innerHTML = t;
} |
When the LCD is added in a later section there won’t be a system displaying the webpage so I will not have an easy way to get the time. I may get the time from a NTP server. Or not display the time. Haven’t yet decided…
About The Graphics
All the graphics, including the sun, are created dynamically. The dials and the graph use a HTML canvas and javascript, the sun is a svg.
Sun/brightness indicator
 I created the sun in a drawing app and then exported as a svg. The original image had all 12 rays visible and because svgs are text files I was able to edit it to show different amount of rays by deleting parts.
The sun has 13 values; 0 rays to 12 rays. The value returned from the analogRead() of the LDR is a value from 0 to 1023, this is converted to a number from 0 and 12 using the Arduino map() function. The new value is then used to determine the number of rays in the image. The brighter it is the more rays there will be.
brightness = map(analogRead(pinLDR), 0, 1023, 0, 12); |
Of course I could have displayed the brightness value as a number (same as the basic webpage) but where is the fun in that.
  // arrays to hold the svg data for the sun icon
  var svgArray = [];
  svgArray[0] = "<?xml version='1.0' encoding='UTF-8'?> <!DOCTYPE svg PUBLIC '-//W3C//DTD SVG 1.1//EN' 'http://www.w3.org/Graphics/SVG/1.1/DTD/svg11.dtd'> <svg xmlns='http://www.w3.org/2000/svg' xml:space='preserve' width='25mm' height='25mm' version='1.1' viewBox='0 0 2500 2500'   xmlns:xlink='http://www.w3.org/1999/xlink'> <defs> <style type='text/css'> <![CDATA[ .str0 {stroke:#aaaaaa; stroke-width:20.00} .str1 {stroke:#aaaaaa; stroke-width:7.5} .str2 {stroke:#aaaaaa; stroke-width:15.00} .fil0 {fill:black} .fil1 {fill:yellow} .fnt0 {font-weight:normal;font-size:400px;font-family:'Verdana'} ]]> </style> </defs> <g id='Layer_x0020_1'> <circle class='fil1 str2' cx='1250' cy='1250' r='680'/>";
  //svgArray[0] = svgArray[0] + "<text x='50%' y='50%' dominant-baseline='middle' text-anchor='middle' class='fil0 fnt0'>[bright]</text>";
  svgArray[1] = "<rect class='fil1 str0' transform='matrix(0.133299 -0.23088 0.246464 0.142296 1562.82 538.757)' width='1604' height='595' rx='280' ry='280'/>";
  svgArray[2] = "<rect class='fil1 str0' transform='matrix(0.23088 -0.133299 0.142296 0.246464 1876.53 790.456)' width='1604' height='595' rx='280' ry='280'/>";
  svgArray[3] = "<rect class='fil1 str1' x='2022' y='1165' width='428' height='169' rx='75' ry='80'/>";
  svgArray[4] = "<rect class='fil1 str0' transform='matrix(-0.23088 -0.133299 0.142296 -0.246464 2246.87 1923.36)' width='1604' height='595' rx='280' ry='280'/>";
  svgArray[5] = "<rect class='fil1 str0' transform='matrix(-0.133299 -0.23088 0.246464 -0.142296 1776.64 2331.58)' width='1604' height='595' rx='280' ry='280'/>";
  svgArray[6] = "<rect class='fil1 str0' transform='matrix(-2.11373E-014 0.266598 -0.284592 -2.25059E-014 1334.71 2022.37)' width='1604' height='595' rx='280' ry='280'/>";
  svgArray[7] = "<rect class='fil1 str0' transform='matrix(0.133299 -0.23088 0.246464 0.142296 576.632 2246.88)' width='1604' height='595' rx='280' ry='280'/> ";
  svgArray[8] = "<rect class='fil1 str0' transform='matrix(0.23088 -0.133299 0.142296 0.246464 168.409 1776.64)' width='1604' height='595' rx='280' ry='280'/>";
  svgArray[9] = "<rect class='fil1 str1' x='50' y='1165' width='428' height='169' rx='75' ry='80'/>";
  svgArray[10] = "<rect class='fil1 str0' transform='matrix(-0.23088 -0.133299 0.142296 -0.246464 538.753 937.178)' width='1604' height='595' rx='280' ry='280'/>";
  svgArray[11] = "<rect class='fil1 str0' transform='matrix(-0.133299 -0.23088 0.246464 -0.142296 790.452 623.465)' width='1604' height='595' rx='280' ry='280'/>";
svgArray[12] = "<rect class='fil1 str0' transform='matrix(-2.11373E-014 0.266598 -0.284592 -2.25059E-014 1334.71 50.0007)' width='1604' height='595' rx='280' ry='280'/>"; |
By putting the svg graphic data in to an array I can easily build the final graphic on the fly using the brightness value. Array element 0 is the the main part of the graphic and required all the time. Then each element from 1 to 12 is one of the rays; element 1 is ray 1, element 2 is ray 2, etc. This means if the brightness value is 4 all I need to do is join together all the array elements 0 to 4. If the brightness value is 9 all I need to do is join together all the array elements 0 to 9. Perfect for a for loop.
function drawSVG(brightnessVal) { // create the sun icon // the number of rays represents the brightness value from 0 to 12 var SVGicon = svgArray[0].replace('[bright]', brightnessVal); for (var i=1; i <= brightnessVal; i++) { SVGicon = SVGicon + svgArray[i]; } document.getElementById('brightnessIcon').innerHTML = SVGicon; } |
 The brightness value can be display as a number inside the centre of the sun, this is disabled by default and can be implemented by uncommenting the following line
//svgArray[0] = svgArray[0] + "<text x='50%' y='50%' dominant-baseline='middle' text-anchor='middle' class='fil0 fnt0'>[bright]</text>"; |
The [bright] tag is replaced with the value when the graphic is built
var SVGicon = svgArray[0].replace('[bright]', brightnessVal); |
Why Use a SVG?
The main reason is to keep the code for the website as a single block and keep the file management as simple as possible. Individual images could be used but this would have meant dealing with 13 different sun icons (possibly using SPIFFS) and using far more memory. Using a svg I have the same image in a much easier way.
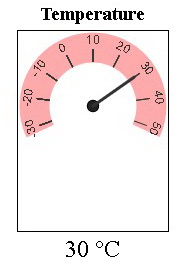
Dials
The dials are redrawn every time there is an update to the value. This happens quick enough that you can’t see it happen.
<canvas id='canvasTemp' width='200' height='150' style='border:1px solid #000000;' > </canvas> |
The dial uses the id to target the correct canvas.
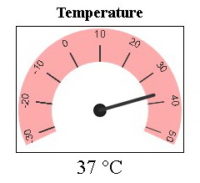
The dials have some flexibility built in, they accept different start and end arc points and you can specify the minimum and maximum values for the scale. You can also set the colour of the arc.
function drawDial(canvasID, dialColour, startAngle, stopAngle, minVal, maxVal, dialValue) |
The dial scales to fit the width of the canvas, which must be created first, the canvas height is not used. This means if the canvas is taller than it is wider the dial will be drawn at the top of the canvas.
 Canvas 200×150
<canvas id='canvasTemp' width='200' height='150' style='border:1px solid #000000;' > </canvas> |
 Canvas 150×200
<canvas id='canvasTemp' width='150' height='200' style='border:1px solid #000000;' > </canvas> |
The size of the canvas should match the arc start and end points. The closer to a full circle the dial is the closer the canvas should be to a square. The closer the arc is to a half circle the wider the canvas should be. Finding the exact size is a case of trial and error.
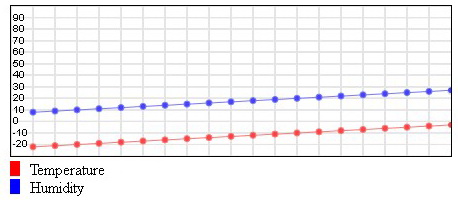
Graph
The graph is designed to show the temperature and humidity. There is some flexibility though; it will resize iteself to the canvas size and the minimum and maximum values used for the scale can be set using gMin and gMax.
The graph is hard codes to have 20 divisions and so plot 20 values across the x axis.
function drawGraph(canvasID, gMin, gMax, drawLines, t,h ) |
The default size of the graph is 440×150. The dimensions can be changed (within reason) by changing the size of the camvas. Give it a try by changing the canvas size in the test/template webpage and see what happens.
 440×150
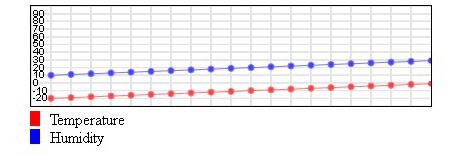 400×100
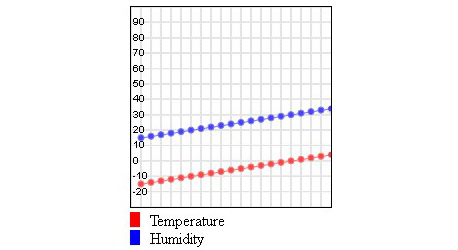 200×200
The drawLines argument is a boolean (true or false) used to tell the function to plot the lines or not. When set to false the graph is drawn but the data is not plotted. This is used when first drawing the graph before data has been received.
t and h are the values to plot. t = temperature and h is the humidity.
I will try to cover the inner workings of the dials and the graph in a separate post. In the meantime the code is well commented and hopefully you should be able to work out what is happening.
ESP8266-10_sketch04_IOT_Website
I am not pasting the sketch in the post just yet but you can download it here.
The sketch follows the same format as previous sketches; the HTML is in a String at the top and the ESP8266 code is mainly at the bottom. Much of the code is the same as in previous guides but put together slightly differently.
There is a slightly different raw string literal used to store the html.
String html_1 = R"=="==( |
This allows me to have mixed quotes in the HTML/javascript and is required for the svg arrays that have single quotes inside double quotes. This is not normally an issue but remember that all the HTML/javascript is contained in another layer quotes in the sketch so we have quotes within quotes within quotes…..
Without using R”==”==( it is difficult to please both the compiler and the browser.
The core of the sketch, the non-HTML part is basically the same as before. Start a webserver, serve the webpage, use a timer to read the sensor values and then send the new values to the webpage.
There is a lot more website code, HTML and especially javascript. Most of it creates the dials and the graph and I will (hopefully) cover these in a post in the future. The actual mechanism (how the webpage works) is pretty much the same as in part 10a. The webpage receives new data via a websocket and the new data is copied to the appropriate parts in the webpage.
If you downloaded the sketch you should certainly notice it is much larger than previous examples and it is becoming inconvenient to navigate.
Separating the HTML
With all the new HTML and javascript the sketch is becoming a little unwieldy and it is time to move the HTML to it’s own file. Not SPIFFS but a file within the sketch that is still part of the sketch. This means the file will be included and uploaded whenever the program is compiled. We can do this using the Arduino IDE tabs function.
Why not use SPIFFS?
The main reason, convenience. The HTML file could be uploaded to SPIFFS and then read by the main sketch, this however, means you need to upload the HTML using the ESP8266 upload function and also compile and upload the sketch. Fine if you have files (like images) that are hard to include in a sketch but not required for what we are doing here. By using a second tab to hold the HTML the HTML is still part of the sketch and gets uploaded when the code is compiled.
Move the HTML to it’s own file and tab
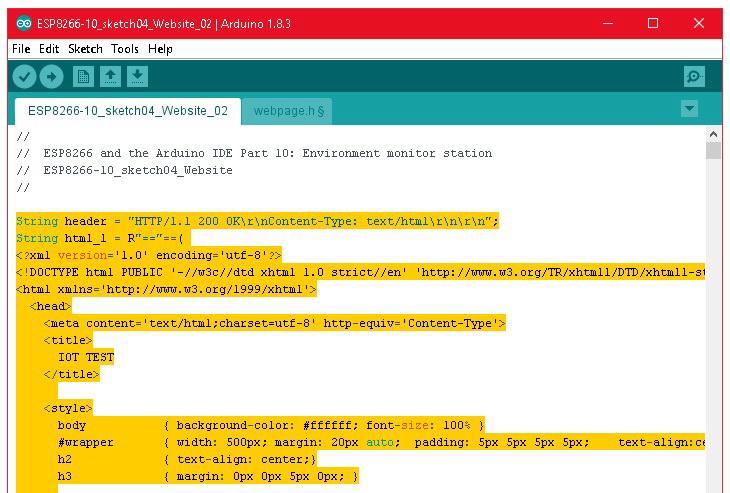
At the top of the sketch we have the two Strings holding the HTML and javascript:
String header = "HTTP/1.1 200 OK\r\nContent-Type: text/html\r\n\r\n"; String html_1 = R"=="==( <?xml version='1.0' encoding='utf-8'?> <!DOCTYPE html PUBLIC '-//w3c//dtd xhtml 1.0 strict//en' 'http://www.w3.org/TR/xhtml1/DTD/xhtml1-strict.dtd'> <html xmlns='http://www.w3.org/1999/xhtml'> <head> . . |
I am going to move these two statements to a separate file. To do this we first create the new file using the tabs function.
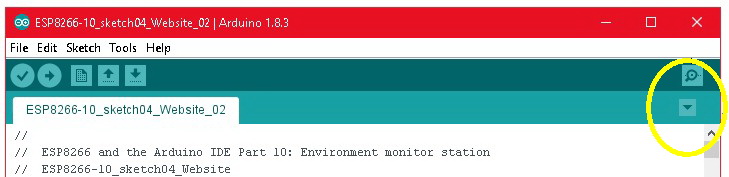
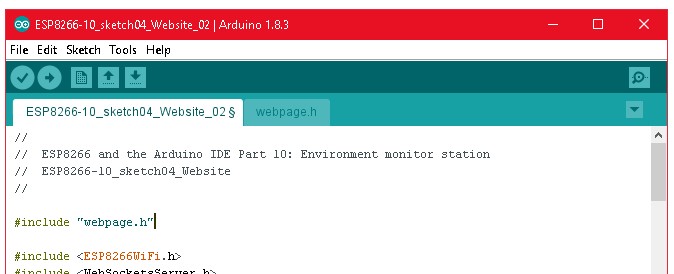
At the top right in the Arduino IDE, click the little down arrow
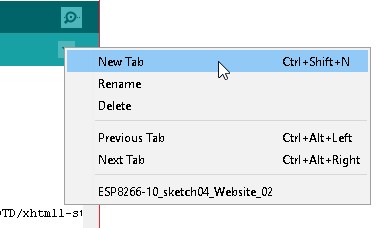
Select New Tab
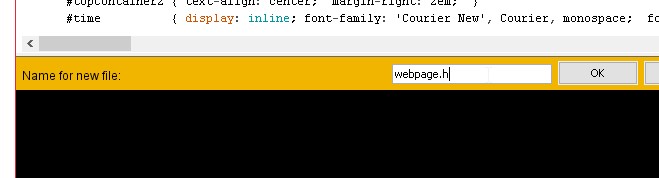
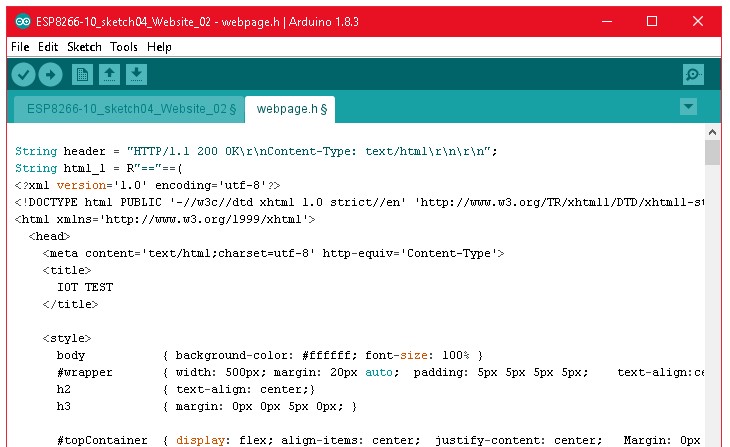
This opens a text box in the console area. Here the name for the new file is entered. I called the file webpage.h
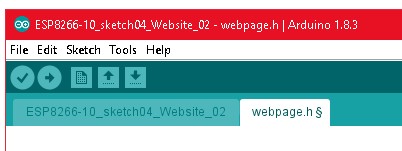
After creating the new file a second tab is avilable in the IDE.
Jump back to the main tab and copy the two String statements.
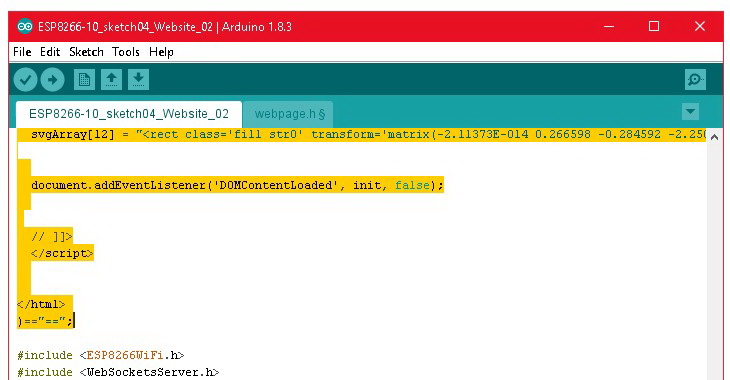
Copy the whole statements and move them to the new tab
Make sure you get the end of the statement
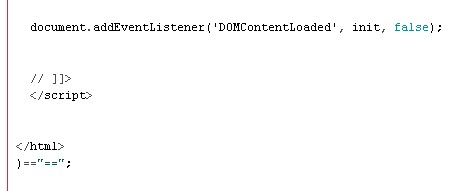
Now we need to tell the sketch to include the file. This is done with the include statement which goes where the String definition statements used to be.
Save the new files before you try compiling otherwise you will get a file not found error.
You can also simply add a new file to the folder the sketch is contained in. Then, when the sketch is loaded the second tab will appear automatically
Why webpage.h and not webpage.html
The Arduino IDE will not include files with a html extension, we need to use .h
ESP8266-10_sketch04_IOT_Website_02
Here is the new sketch. First the main tab and then the webpage.h tab.
//
// ESP8266 and the Arduino IDE Part 10: Environment monitor station
// ESP8266-10_sketch04_IOT_Website_02
//
#include "webpage.h"
#include <ESP8266WiFi.h>
#include <WebSocketsServer.h>
WiFiServer server(80);
WebSocketsServer webSocket = WebSocketsServer(81);
char ssid[] = "mySSID"; // change these to your network credentials
char pass[]= "myPassword";
#include "DHT.h"
#define DHTPIN D6
#define DHTTYPE DHT11
DHT dht(DHTPIN, DHTTYPE);
byte const pinLED = D8;
byte const pinLDR = A0;
int brightness = 0;
float humidity = 0;
float tempC = 0;
float tempF = 0;
boolean DHTreadingsOK = false;
boolean updateWebpage = false;
long sensorUpdateFrequency = 5000;
long timeNow = 0;
long timePrev = 0;
void setup()
{
pinMode(pinLED, OUTPUT); digitalWrite(pinLED, LOW);
dht.begin();
Serial.begin(9600);
while (!Serial) {;}
Serial.println();
Serial.println("Serial started at 9600");
Serial.println();
// Connect to a WiFi network
Serial.print("Connecting to "); Serial.println(ssid);
// try to connect to the network
WiFi.begin(ssid,pass);
// connection with timeout
int count = 0;
digitalWrite(pinLED, HIGH);
while ( (WiFi.status() != WL_CONNECTED) && count < 17)
{
Serial.print("."); count++; delay(500);
}
digitalWrite(pinLED, LOW);
if (WiFi.status() != WL_CONNECTED)
{
Serial.println(""); Serial.print("Failed to connect to "); Serial.println(ssid);
while(1);
}
Serial.println("");
Serial.print("Connected. IP address = "); Serial.println(WiFi.localIP());
// start a server
server.begin();
Serial.println("Server started");
// start the websocket
webSocket.begin();
Serial.println("websocket started");
Serial.println("");
Serial.println("");
// webSocketEvent is the function to call when there is a websocket event
webSocket.onEvent(webSocketEvent);
}
void loop()
{
// check the websocket status.
webSocket.loop();
// Check if a client has connected
WiFiClient client = server.available();
// if a client has connected send the webpage
if (client)
{
client.flush();
client.print( header );
client.print( html_1 );
Serial.println("New page served");
Serial.println("");
updateSensors();
}
// see if it is time to update the sensor values on the website
timeNow = millis();
if (timeNow - timePrev >= sensorUpdateFrequency)
{
timePrev = timeNow;
// if it is time, call the updateSensors() function
updateSensors();
}
} // void loop()
void updateSensors()
{
brightness = map(analogRead(pinLDR), 0, 1023, 0, 12);
//brightness = analogRead(pinLDR);
humidity = dht.readHumidity();
tempC = dht.readTemperature(); // Read temperature as Celsius
tempF = dht.readTemperature(true); // Read temperature as Fahrenheit (isFahrenheit = true)
//if any value is isnan (not a number) then there is an error
if (isnan(humidity) || isnan(tempC) || isnan(tempF))
{
Serial.println("Error reading from the DHT11.");
}
else
{
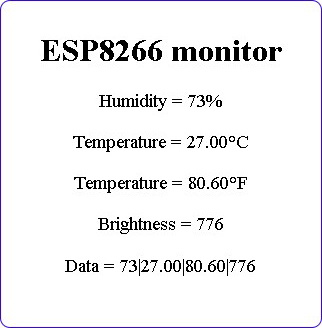
String data = "";
data = String(data + byte(humidity) );
data = String(data + "|");
data = String(data + tempC);
data = String(data + "|");
data = String(data + tempF);
data = String(data + "|");
data = String(data + brightness);
webSocket.broadcastTXT(data); // send the data
Serial.println(data); // display the data in the serial monitor
// blink the status LED to show data has been sent
digitalWrite(pinLED, HIGH); delay(50); digitalWrite(pinLED, LOW);
}
} // void updateSensors()
// webSocketEvent is called when there is a websocket event
void webSocketEvent(byte num, WStype_t type, uint8_t * payload, size_t length)
{
Serial.println("");
Serial.print("WStype = "); Serial.println(type);
Serial.print("WS payload = ");
for(int i = 0; i < length; i++) { Serial.print((char) payload[i]); }
Serial.println();
} |
And here is the HTML.
String header = "HTTP/1.1 200 OK\r\nContent-Type: text/html\r\n\r\n";
String html_1 = R"=="==(
<?xml version='1.0' encoding='utf-8'?>
<!DOCTYPE html PUBLIC '-//w3c//dtd xhtml 1.0 strict//en' 'http://www.w3.org/TR/xhtml1/DTD/xhtml1-strict.dtd'>
<html xmlns='http://www.w3.org/1999/xhtml'>
  <head>
    <meta content='text/html;charset=utf-8' http-equiv='Content-Type'>
    <title>
      IOT TEST
    </title>

    <style>
      body           { background-color: #ffffff; font-size: 100% }
      #wrapper       { width: 500px; margin: 20px auto;  padding: 5px 5px 5px 5px;    text-align:center;   border: 2px solid blue;   border-radius: 15px;  }
      h2             { text-align: center;}
      h3             { margin: 0px 0px 5px 0px; }

      #topContainer  { display: flex; align-items: center;  justify-content: center;   Margin: 0px auto 2em auto;}
      #topContainer2 { text-align: center;  margin-right: 2em;  }
      #time          { display: inline; font-family: 'Courier New', Courier, monospace;  font-size: 250%;   }

      #dialContainer { display:inline-block;   margin: 0px auto 0px auto;  }
      #dial_1        { display:inline-block;  }
      #dial_2        { display:inline-block; margin: 0px 0px 0px 30px; }
      canvas         { background-color: #ffffff;    }
      .bigText       { font-size: 150%;}
      .noMargin      { margin: 0px 0px 0px 0px; }

      #graphContainer { display:inline-block;  text-align:left; margin: 20px 0px 20px 0px;  }
      #key            { width: 200px;}
      .box            { float: left;  height:15px;  width:10px;  margin: 0px 10px 0px 0px; clear: both;     }
      .red            { background-color: red; }
      .blue           { background-color: blue; }
    </style>

  </head>

  <body >
      <div id='wrapper'>

        <h1>Temperature & Humidity</h1>

        <div id='topContainer'>
            <div id='topContainer2'>
            <div id='brightnessIcon'></div>
            <div id='label'>Brightness</div>
          </div>
          <span id='time'>00:00:00</span>
        </div>

         <div id='dialContainer'>
           <div id='dial_1'>
             <h3>Temperature</h3>
             <canvas id='canvasTemp' width='200' height='150'  style='border:1px solid #000000;' > </canvas>
             <p class='noMargin bigText'><span id='temp'>00</span> °C</p>
           </div>

           <div id='dial_2'>
             <h3>Humidity</h3>
             <canvas id='canvasHumid' width='200' height='150'  style='border:1px solid #000000;' > </canvas>
             <p class='noMargin bigText'><span id='humd'>00</span> %</p>
           </div>
         </div>  <!--  'dialContainer'  -->

         <div id='graphContainer'>
           <canvas id='graph' width='440' height='150'  style='border:1px solid #000000; background-color:white;' > </canvas>
           <div id='key'>
             <div> <div class='box red'></div> Temperature</div>
             <div> <div class='box blue'></div> Humidity</div>
           </div>
         </div>

      </div> <!--  'wrapper'  -->
  </body>

  <script type='text/javascript'>
  // <![CDATA[

  function updateValues(h,t,b)
  {

    drawSVG(b);
    drawDial('canvasTemp',  '#ffaaaa', 160, 20, -30,  50, t);
    drawDial('canvasHumid', '#aaaaff', 160, 20,   0, 100, h);
    document.getElementById('temp').innerHTML = t;
    document.getElementById('humd').innerHTML = h;

    var graphCanvas = 'graph';
    var graphMin = -30;
    var graphMax = 100;
    var drawLines = true;
    drawGraph(graphCanvas, graphMin, graphMax, drawLines, t, h);
  }


  // ===========================================  DIAL  =========================================

  function drawDial(canvasID, dialColour, startAngle, stopAngle, minVal, maxVal, dialValue)
  {
    oneDegreeInRadians = Math.PI/180;
    if (stopAngle < startAngle) { stopAngle = stopAngle + 360;}

    let arcStartAngleInRadians =  oneDegreeInRadians * (startAngle-5)  ;
    let arcStopAngleInRadians  =  oneDegreeInRadians * (stopAngle+5) ;

    var c = document.getElementById(canvasID);
    var ctx = c.getContext('2d');
    ctx.clearRect(0, 0, c.width, c.height);
    ctx.save();

    let H = c.height;
    let W = c.width;

    let arcLineWidth = W/5;
    ctx.translate(W/2, W/2);        // move coordinates 0,0 to the centre of the canvas

    // draw arc
    ctx.beginPath();
    let radius = W/2 - (arcLineWidth/2) - (W/100);
    ctx.lineWidth = arcLineWidth;
    ctx.lineCap = 'butt';
    ctx.strokeStyle = dialColour;
    ctx.arc(0, 0, radius, arcStartAngleInRadians, arcStopAngleInRadians, false);
    ctx.stroke();


    // draw centre circle
    ctx.beginPath();
    let centerCircleRadius = W/100*3.5
    ctx.strokeStyle = '#000000';
    ctx.fillStyle = '#222222';
    ctx.lineWidth = 2;
    ctx.arc(0, 0, centerCircleRadius, 0, 2 * Math.PI, true);
    ctx.stroke();
    ctx.fill();


    // draw ticks
    ctx.beginPath();
    ctx.lineWidth = 1;
    ctx.lineCap = 'butt';
    ctx.strokeStyle = '#333333';

    ctx.font = '12px Arial';
    ctx.fillStyle = '#333333';
    ctx.textAlign = 'center';
    ctx.textBaseline = 'top';

    let tickStartPoint = radius - (arcLineWidth/2) ;   // bottom of the arc
    let tickLength =  5/8 * arcLineWidth - 5;

    let labelPos = radius + (arcLineWidth/2) - 2;

    for (let angle=minVal; angle<=maxVal; angle = angle+10)
    {
      let angleInDegrees =  (angle-minVal) *  ((stopAngle - startAngle) / (maxVal - minVal)) + startAngle  ;
      let angleInRadians = angleInDegrees * oneDegreeInRadians;

      ctx.rotate(angleInRadians );
      ctx.moveTo(tickStartPoint, 0 );
      ctx.lineTo(tickStartPoint + tickLength, 0 );
      ctx.stroke();

      // draw the label at the right angle.
      // rotate the dial - 90 degree, draw the text at the new top of the dial, then rotate +90.
      // this means we use the - y axis.

      ctx.rotate(90*oneDegreeInRadians);
      ctx.fillText(angle.toString(), 0, -labelPos );
      ctx.rotate(-90*oneDegreeInRadians);

      ctx.rotate(-angleInRadians);  //  this puts the dial back where it was.
    }


    // draw the pointer

    // map the value to a degree
    let pointerAngleInDegrees =  (dialValue-minVal) *  ((stopAngle - startAngle) / (maxVal - minVal)) + startAngle  ;
    let pointerAngleInRadians = pointerAngleInDegrees * oneDegreeInRadians;

    let pointerLength = radius*0.86;
    let pointerWidth = W/100 * 2;

    ctx.beginPath();
    ctx.lineWidth = pointerWidth;
    ctx.lineCap = 'round';
    ctx.moveTo(0,0);
    ctx.rotate(pointerAngleInRadians);
    ctx.lineTo(pointerLength, 0);
    ctx.stroke();
    ctx.rotate(-pointerAngleInRadians);

    // reset the coordinates ready for next time
    ctx.restore();

  }


  function drawGraph(canvasID, gMin, gMax, drawLines, t,h )
  {

    // Graph Init - draw the graph but do not draw values.

    var c = document.getElementById(canvasID);
    var ctx = c.getContext('2d');
    ctx.clearRect(0, 0, c.width, c.height);

    var graphWidth  = c.width;
    var graphHeight = c.height;

    var fontSize = '10px Arial';
    var fontAdjust = 3;
    if (graphHeight < 100) { fontSize = '6px Arial'; fontAdjust = 1;}

    var numySteps = gMax - gMin;
    if (numySteps > 10) { numySteps = numySteps /10; }
    var numxSteps = 20;

    var xStep = graphWidth / numxSteps;
    var yStep = graphHeight / numySteps;


    ctx.lineWidth = 1;
    ctx.strokeStyle = '#e5e5e5';
    ctx.lineCap = 'butt';
        for (let x = 0; x < c.width; x=x+xStep)
    {
       ctx.moveTo(x, 0);    ctx.lineTo(x, c.height);     ctx.stroke();
    }

        for (let y = 0; y <= numySteps; y++)
    {
       let yPos = y * yStep;
       ctx.moveTo(0, yPos);    ctx.lineTo(c.width,yPos);    ctx.stroke();
    }

    // draw labels
    ctx.font = fontSize;
    ctx.fillStyle = '#000000';

    // no need to draw the first or the last label
    for (let i = 1; i < numySteps; i++)
    {
         let yPos = c.height - i * yStep;
         let tmp = i * 10;
         tmp = tmp + gMin;
         let txt = tmp.toString();
         ctx.fillText(txt, 2, yPos + fontAdjust);
    }


    // draw the  values on the graph
    if (drawLines)
    {
        tempArray.shift();  tempArray[19] = t;
        humdArray.shift();  humdArray[19] = h;

        // Temperature
        ctx.beginPath();
        ctx.lineWidth = 1;
        ctx.strokeStyle = '#ff7777';
        ctx.fillStyle   = '#ff4444';

        // on the first value we are not coming from an existing point so we just need to move to the coordinates ready to plot value 2.
        let firstValue = true;

        for (let i = 0; i < numxSteps; i++)
        {
            if (tempArray[i] != -9999)
            {
                let tmpVal = tempArray[i] ;
                let yPos = (tmpVal - gMin) * (graphHeight - 0)/( gMax - gMin ) + 0;
                yPos = graphHeight - yPos;
                let xPos = (i*xStep) + xStep;

                // draw the line
                if (firstValue)   {  ctx.moveTo(xPos, yPos);  firstValue = false;  }
                else              {  ctx.lineTo(xPos,yPos);   ctx.stroke();  }

                // draw the dot
                ctx.beginPath();  ctx.arc(xPos, yPos, 3, 0, 2 * Math.PI, false);  ctx.fill();
            }
        }


        // Humidity
        ctx.lineWidth = 1;
        ctx.strokeStyle = '#7777ff';
        ctx.fillStyle   = '#4444ff';
        ctx.beginPath();

        // on the first value we are not coming from an existing point so we just need to move to the coordinates ready to plot value 2.
        firstValue = true;

        for (let i = 0; i < numxSteps; i++)
        {
            if (humdArray[i] != -9999)
            {
                let tmpVal = humdArray[i] ;
                let yPos = (tmpVal - gMin) * (graphHeight - 0)/( gMax - gMin ) + 0;
                yPos = graphHeight - yPos;
                let xPos = (i*xStep) + xStep;

                // draw the line
                if (firstValue)   {  ctx.moveTo(xPos, yPos);  firstValue = false;  }
                else              {  ctx.lineTo(xPos,yPos);   ctx.stroke();  }

                // draw the dot
                ctx.beginPath();  ctx.arc(xPos, yPos, 3, 0, 2 * Math.PI, false);  ctx.fill();
            }
        }

    } // if (! initOnly)
  } // function drawGraph


  function drawSVG(brightnessVal)
  {
    // create the sun icon
    // the number of rays represents the brightness value from 0 to 12

    // when adding the actual value to the graphic, this updates the value. When the text part is not used it has no affect.
    var SVGicon = svgArray[0].replace('[bright]', brightnessVal);
    for (var i=1; i <= brightnessVal; i++)  { SVGicon = SVGicon + svgArray[i];  }
    document.getElementById('brightnessIcon').innerHTML = SVGicon;
  }


  function processReceivedData(evt)
  {
    var data = evt.data;
    console.log(data);

    var tmp = data.split('|');

    // convert the received string in to numbers
    var h = parseInt(tmp[0]);
    var t = parseInt(tmp[1]);
    var b = parseInt(tmp[3]);
    updateValues(h,t,b);
  }


  function updateTime()
  {
     var d = new Date();
     var t = d.toLocaleTimeString();
     document.getElementById('time').innerHTML = t;
  }

  // This is executed after the document has finished loading.
  function init()
  {
    Socket = new WebSocket('ws://' + window.location.hostname + ':81/');
    Socket.onmessage = function(event) { processReceivedData(event); };

    console.log('started');
    drawDial('canvasTemp',  '#ffaaaa', 160, 20, -30,  50, 0);
    drawDial('canvasHumid', '#aaaaff', 160, 20,   0, 100, 0);
    drawGraph('graph', -30, 100, false, t, h);
    drawSVG(0);

    var myVarTime = setInterval(updateTime, 1000);
  }


  // arrays to hold the temperature and humidity values.
  var tempArray = [ -9999,-9999,-9999,-9999,-9999,-9999,-9999,-9999,-9999,-9999,-9999,-9999,-9999,-9999,-9999,-9999,-9999,-9999,-9999,-9999 ];
  var humdArray = [ -9999,-9999,-9999,-9999,-9999,-9999,-9999,-9999,-9999,-9999,-9999,-9999,-9999,-9999,-9999,-9999,-9999,-9999,-9999,-9999 ];

  var t = -30;
  var h = 0;
  var b = 0;

  // arrays to hold the svg data for the sun icon
  var svgArray = [];
  svgArray[0] = "<?xml version='1.0' encoding='UTF-8'?> <!DOCTYPE svg PUBLIC '-//W3C//DTD SVG 1.1//EN' 'http://www.w3.org/Graphics/SVG/1.1/DTD/svg11.dtd'> <svg xmlns='http://www.w3.org/2000/svg' xml:space='preserve' width='25mm' height='25mm' version='1.1' viewBox='0 0 2500 2500'   xmlns:xlink='http://www.w3.org/1999/xlink'> <defs> <style type='text/css'> <![CDATA[ .str0 {stroke:#aaaaaa; stroke-width:20.00} .str1 {stroke:#aaaaaa; stroke-width:7.5} .str2 {stroke:#aaaaaa; stroke-width:15.00} .fil0 {fill:black} .fil1 {fill:yellow} .fnt0 {font-weight:normal;font-size:400px;font-family:'Verdana'} ]]> </style> </defs> <g id='Layer_x0020_1'> <circle class='fil1 str2' cx='1250' cy='1250' r='680'/>";
  //svgArray[0] = svgArray[0] + "<text x='50%' y='50%' dominant-baseline='middle' text-anchor='middle' class='fil0 fnt0'>[bright]</text>";
  svgArray[1] = "<rect class='fil1 str0' transform='matrix(0.133299 -0.23088 0.246464 0.142296 1562.82 538.757)' width='1604' height='595' rx='280' ry='280'/>";
  svgArray[2] = "<rect class='fil1 str0' transform='matrix(0.23088 -0.133299 0.142296 0.246464 1876.53 790.456)' width='1604' height='595' rx='280' ry='280'/>";
  svgArray[3] = "<rect class='fil1 str1' x='2022' y='1165' width='428' height='169' rx='75' ry='80'/>";
  svgArray[4] = "<rect class='fil1 str0' transform='matrix(-0.23088 -0.133299 0.142296 -0.246464 2246.87 1923.36)' width='1604' height='595' rx='280' ry='280'/>";
  svgArray[5] = "<rect class='fil1 str0' transform='matrix(-0.133299 -0.23088 0.246464 -0.142296 1776.64 2331.58)' width='1604' height='595' rx='280' ry='280'/>";
  svgArray[6] = "<rect class='fil1 str0' transform='matrix(-2.11373E-014 0.266598 -0.284592 -2.25059E-014 1334.71 2022.37)' width='1604' height='595' rx='280' ry='280'/>";
  svgArray[7] = "<rect class='fil1 str0' transform='matrix(0.133299 -0.23088 0.246464 0.142296 576.632 2246.88)' width='1604' height='595' rx='280' ry='280'/> ";
  svgArray[8] = "<rect class='fil1 str0' transform='matrix(0.23088 -0.133299 0.142296 0.246464 168.409 1776.64)' width='1604' height='595' rx='280' ry='280'/>";
  svgArray[9] = "<rect class='fil1 str1' x='50' y='1165' width='428' height='169' rx='75' ry='80'/>";
  svgArray[10] = "<rect class='fil1 str0' transform='matrix(-0.23088 -0.133299 0.142296 -0.246464 538.753 937.178)' width='1604' height='595' rx='280' ry='280'/>";
  svgArray[11] = "<rect class='fil1 str0' transform='matrix(-0.133299 -0.23088 0.246464 -0.142296 790.452 623.465)' width='1604' height='595' rx='280' ry='280'/>";
  svgArray[12] = "<rect class='fil1 str0' transform='matrix(-2.11373E-014 0.266598 -0.284592 -2.25059E-014 1334.71 50.0007)' width='1604' height='595' rx='280' ry='280'/>";


  document.addEventListener('DOMContentLoaded', init, false);

  // ]]>
  </script>

</html>
)=="=="; |
Using two files/tabs makes copying the sketch a little more difficult so it may be easier to download here.
Downloads
ESP8266-10_sketch04_IOT_Website.zip (single file/tab)
ESP8266-10_sketch04_IOT_Website_02.zip (2 files/tabs)
https://www.martyncurrey.com/?wpdmdl=8879
I have tested your program and it is brilliant, easy to implement and it works perfect.
I have adapted to work with ESP01 , just taking away the signal of the LDR and changing a few things in the webpage.h
#include “webpage.h”
#include
#include
WiFiServer server(80);
WebSocketsServer webSocket = WebSocketsServer(81);
char ssid[] = “your ssid”;
char pass[]= “your password”;
#include “DHT.h”
//#define DHTPIN D6
#define DHTPIN 2
#define DHTTYPE DHT11
DHT dht(DHTPIN, DHTTYPE);
//byte const pinLED = D5;
//byte const pinLDR = A0;
int brightness = 0;
float humidity = 0;
float tempC = 0;
float tempF = 0;
boolean DHTreadingsOK = false;
boolean updateWebpage = false;
long sensorUpdateFrequency = 5000;
long timeNow = 0;
long timePrev = 0;
void setup()
{pinMode(LED_BUILTIN, OUTPUT); // Initialize the LED_BUILTIN pin as an output
digitalWrite(LED_BUILTIN, LOW); // Turn the LED on (Note that LOW is the voltage level
// pinMode(pinLED, OUTPUT); digitalWrite(pinLED, LOW);
dht.begin();
Serial.begin(115200);
while (!Serial) {;}
Serial.println();
Serial.println();
Serial.println();
Serial.println();
Serial.println(“***************************************”);
Serial.println(“* ESTACION_METEO_GRAFICOSv1 *”);
Serial.println(“***************************************”);
Serial.println();
// Connect to a WiFi network
Serial.print(“CONECTADO A “); Serial.println(ssid);
// try to connect to the network
WiFi.begin(ssid,pass);
// connection with timeout
int count = 0;
//digitalWrite(pinLED, HIGH);
digitalWrite(LED_BUILTIN, HIGH); // Turn the LED off by making the voltage HIGH
while ( (WiFi.status() != WL_CONNECTED) && count = sensorUpdateFrequency)
{
timePrev = timeNow;
// if it is time, call the updateSensors() function
updateSensors();
}
} // void loop()
void updateSensors()
{
//brightness = map(analogRead(pinLDR), 0, 1023, 0, 12);
//brightness = analogRead(pinLDR);
humidity = dht.readHumidity();
tempC = dht.readTemperature(); // Read temperature as Celsius
tempF = dht.readTemperature(true); // Read temperature as Fahrenheit (isFahrenheit = true)
//if any value is isnan (not a number) then there is an error
if (isnan(humidity) || isnan(tempC) || isnan(tempF))
{
Serial.println(“Error reading from the DHT11.”);
}
else
{
String data = “”;
data = String(data + byte(humidity) );
data = String(data + “|”);
data = String(data + tempC);
data = String(data + “|”);
data = String(data + tempF);
// data = String(data + “|”);
//data = String(data + brightness);
webSocket.broadcastTXT(data); // send the data
Serial.println(data); // display the data in the serial monitor
// blink the status LED to show data has been sent
digitalWrite(LED_BUILTIN, HIGH); delay(50); digitalWrite(LED_BUILTIN,LOW);
}
} // void updateSensors()
// webSocketEvent is called when there is a websocket event
void webSocketEvent(byte num, WStype_t type, uint8_t * payload, size_t length)
{
Serial.println(“”);
Serial.print(“WStype = “); Serial.println(type);
Serial.print(“WS payload = “);
for(int i = 0; i < length; i++) { Serial.print((char) payload[i]); }
Serial.println();
}
IN WEBPAGE.H
// convert the received string in to numbers
var h = parseInt(tmp[0]);
var t = parseInt(tmp[1]);
//var b = parseInt(tmp[3]);
//updateValues(h,t,b); LINE TO MODIFY
updateValues(h,t);
Hello martyn
i am not able to get the output on the webpage.
then i figured out that when i do page inspect I am not able to see the full HTML code.I am facing this problem.do u know how to solve it
Try adding a
client.stop();
after
Serial.println(“”);
updateSensors();
Thanks I will also try this . I used PROGMEM to store the html code into flash memory and it worked.
I do not understand this can you explain help me , please you:
oneDegreeInRadians = Math.PI/180;
if (stopAngle < startAngle) { stopAngle = stopAngle + 360;}
let arcStartAngleInRadians = oneDegreeInRadians * (startAngle-5) ;
let arcStopAngleInRadians = oneDegreeInRadians * (stopAngle+5) ;
Disclaimer: I am by no means an expert. It has been a long time since I did this a school…
The Javascript canvas works in radians so you need to covert from degrees to radians to draw arcs. I prefer degrees and a (fairly) simple method to get the position in an arc is to multiply the radian by pi.
Have a look at https://www.w3schools.com/tags/canvas_arc.asp as a start.
The let arcStartAngleInRadians = oneDegreeInRadians * (startAngle-5) extends the arc slightly. If you look at the above picture you can see the arc goes slightly past the start and end of the scale.
There is far more to this and I suggest Goggling. There are many guides on line.
I tested your program and it is awesome, easy to do and it works perfectly.
I have upgraded some more sensors to the website but it doesn’t send data continuously to the website please help